Visual Information
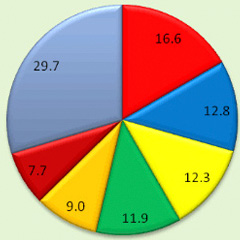
Visual information helps organise the speech, both by reminding the presenter of the key points he/she planned to include and illustrating these for the audience. There are various types of visuals such as diagram, chart, graphic, image, picture, photo, flow chart, statistics, illustration, sketch, plan, timetable, time-line, mind-map, grid, elevation.

DIAGRAMS
|
|
|
|
|
|
|
VERBS USED TO REFER TO DIAGRAMS
illustrate, show, suggest, indicate, represent, demonstrate, give, reflect.
illustrate, show, suggest, indicate, represent, demonstrate, give, reflect.
DESCRIBING TRENDS
|
|
|
|
|
|
|
|
|
|
|
|
|
Much research in academic life contains statistical data. These data, in the form of visuals, can express a lot of information concisely and are more convincing and attractive.